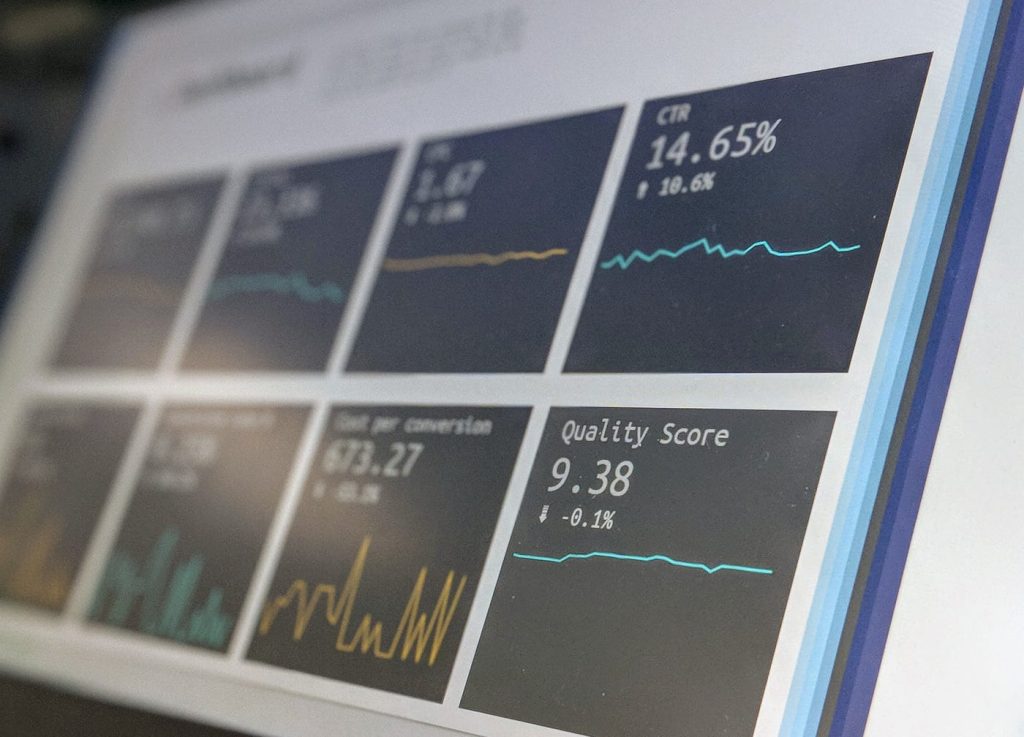
In an age of rising digital transactions, social engineering, and increasingly sophisticated scams, detecting and preventing fraud has become a critical business function. But identifying fraud is not just about catching bad actors—it is about empowering your teams with visibility, insights, and actionable data. A well-designed fraud prevention dashboard serves as the nerve center of this strategy, giving organizations a real-time view of threats, performance, and emerging trends.
Here is how to build an effective fraud prevention dashboard and use it to strengthen both your systems and your people.
Why a Fraud Prevention Dashboard Matters
Fraud detection is not a one-time effort—it is a continuous process. Organizations collect massive amounts of data daily, from transaction logs and call recordings to agent notes and behavioral patterns. Without a centralized way to analyze and visualize this information, potential risks can go unnoticed.
A fraud prevention dashboard consolidates this data into a single interface, offering real-time alerts, trend analysis, and performance metrics. It allows managers, compliance officers, and analysts to identify weak points, monitor team response, and make data-driven decisions to reduce exposure.
Ultimately, the goal is simple: transform raw data into actionable intelligence.
Key Metrics Every Fraud Prevention Dashboard Should Track
Building an effective dashboard starts with identifying the right metrics. While the exact indicators may vary across industries, the following are essential for most organizations:
1. Fraud Attempt Rate
This metric tracks the total number of fraudulent attempts detected within a specific period. Monitoring spikes or dips helps organizations identify seasonal trends, new fraud schemes, or vulnerabilities in specific channels.
2. Detection Accuracy
False positives can waste resources and frustrate customers, while false negatives can lead to financial loss. Measuring detection accuracy ensures that your system is identifying true fraud events without over-flagging legitimate transactions or interactions.
3. Average Response Time
Once a fraud attempt is detected, how quickly does your team act? The time between detection and mitigation is critical, especially in high-volume contact centers or e-commerce environments.
4. Fraud Loss Amount
This financial metric shows the total cost of successful fraud incidents. Tracking it helps leadership evaluate the ROI of their prevention strategies and justify further investments in automation or training.
5. Agent Compliance and Performance Metrics
For customer service or contact center operations, agent behavior plays a key role. Tracking compliance with verification protocols, adherence to scripts, and response to real-time alerts can reveal gaps in training or awareness.
Identifying Trends Through Data Visualization
A well-structured dashboard does not just display numbers—it reveals patterns. Visualization tools such as line graphs, heat maps, and trend lines can highlight recurring fraud types, high-risk geographies, or vulnerable time frames.
For instance, you might notice a rise in refund fraud following a promotional period or a spike in phishing-related calls during certain months. These insights allow your fraud prevention team to respond proactively rather than reactively.
Conclusion
A well-built fraud prevention dashboard is not just a reporting tool—it is a strategic asset that drives awareness, accountability, and proactive defense. By tracking key metrics, visualizing trends, and translating data into actionable coaching insights, organizations can stay one step ahead of fraudsters.
When your data works as hard as your team, fraud prevention becomes not just a function—but a competitive advantage.
